Friday, March 27, 2020

Knowledge Integration


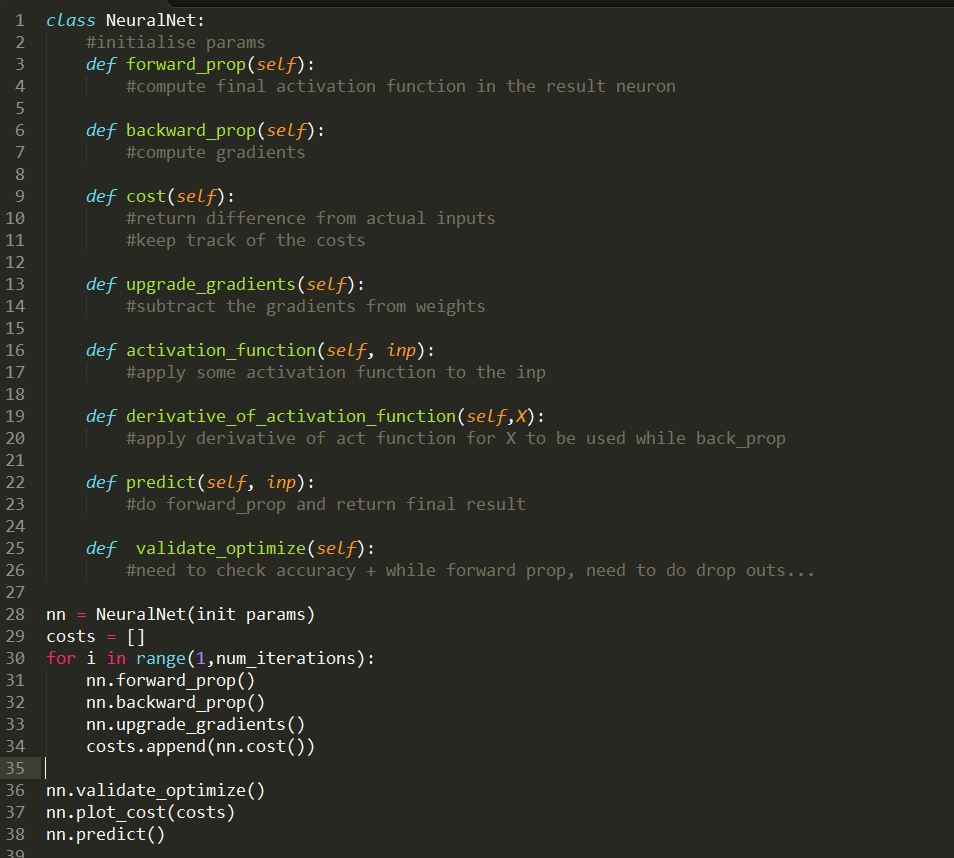
As a part of my seminar at the University, I got an opportunity to explore ideas related to integrating Knowledge to a Neural Network to enhance its performance. Just sharing some pretty interesting ideas here. 

Expert systems are the ones that provide a clear explanation while decision making. Incorporating this to a neural network would enable the neural network to outperform its baseline model in terms of accuracies and explainability.

Considering an application of time series forecasting — let’s say, stock price prediction, or more relevant, let us consider forecasting COVID-19 cases over a period in a region. Just feeding the model with historical cases and expecting it to give a valid prediction, might, from my perspective, be flawed as several external factors need to be considered. Factors like the changes in the precautionary measures by the government, the lockdowns that were put to place, social distancing that took shape over a period, age groups that get affected over the period, etc.
There has to be a way we can embed all the above extra relevant information to the neural network to make more realistic /explainable predictions.
The explainable part can be analogous to the explainable aspects that come into play when considering Computer Vision applications in Neural Networks like visualizing gradients, visualizing activation maps, etc.
An overview of how the system might be structured


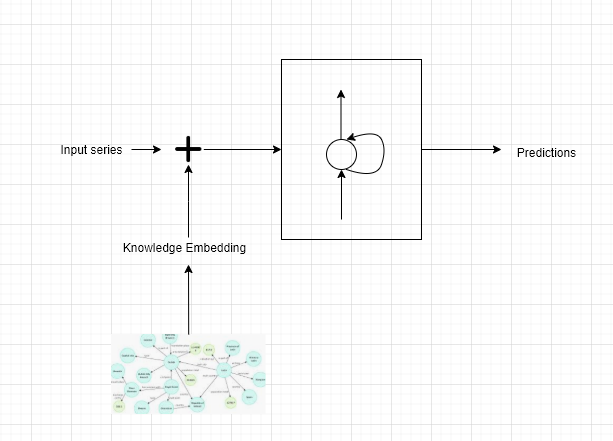
The first idea that was pretty cool, was to be able to get the knowledge embedding(KB) that is highly relevant to the input. KB is very similar to the word embedding (eg: word2vec, GloVe models) where the knowledge encoded as a triplet(eg <Corona, affects, Lungs>), is mapped to an embedding vector. There are a bunch of techniques available to determine the vector corresponding to the triplet. One such example is the TransE model. Once, Knowledge Embedding for an information triplet is known, the next step is to concatenate this with the normal input vector of #cases over a period.
In the case of COVID cases prediction, one can feed the model with not just the previous cases but also the current state of the region (ie in the form of a news article). Even better, one can maintain a knowledge graph as and when things unravel by updating the connections in the graph. Finally, during prediction, extract relevant sub-graphs from the knowledge graph, convert them to the KB embedding and feed it to the Neural Network. This allows the network to gain deeper insights into the situation.


There are variations in the above technique, like incorporating attention mechanism for the neighbours of a considered KB embedding, which I have touched upon in my survey paper:

https://arxiv.org/abs/2008.05972

The second idea talks about altering the states of a sequence-to-sequence model. A seq-to-seq model is used for predicting an output sequence given an input sequence (eg: Lang Translation). An encoder-decoder architecture is used for this purpose, where each stage of the model is made up of a Recurrent Neural Network (variants like LSTM, GRU can be used).
The expert knowledge is maintained as another trained RNN model. During training, at a given time step(state) of our Neural Network, we integrate the hidden state of our “to be trained ” model with the corresponding state of the trained RNN model via a gated mechanism — this ensures focussing on things at a granular level while predicting the output sequence.

The third idea considers the desired and predicted probability distributions of the expert knowledge and our model. It tries to train our model, by ensuring our model’s probability distribution P(X|Y) where Y can be the input sequence and X being the output sequence to stay as close (Kullback Leibler divergence) to the distribution of the expert knowledge. This desired probability distribution can be built either manually, considering another trained Neural Network, or using some kind of an n-gram model.

There are several such ideas that I came across, that includes using a CNN for forecasting, using Fuzzy Sets, etc, that can be checked in the attached survey paper. I think conveying all of them here might lead to confusion.

All in all, I think, providing the neural network with additional information that is relevant to the input, gives an edge to the neural network to make more realistic predictions. This enables us to attain a kind of synergy between an Expert system and a Neural Network to capture the best parts of both systems.

Tuesday, March 24, 2020

COVID hackathon

So, with the onset of COVID-19, all the governments are doing whatever they can to support the fight against the virus.

On those lines, I came across a portal

https://www.bundesregierung.de/breg-de/themen/coronavirus/wir-vs-virus-1731968

where the German Govt organized a 48 hour Remote Hackathon asking the public to come up with possible solutions/prototypes to tackle several challenges. Some of those challenges were -  optimal resource(staff, medical equipment..) allocations, handling mental conditions of people while at home-isolation, remote assistance/ diagnosis and recommendations for concerned patients. I personally liked the idea of alerting an individual about how risky is his current situation (using GPS, the infection spread at his location, predicting /estimating spread) allowing him/her to plan their travel accordingly.

I got a chance to be a part of the event with a team from my workplace. Although everything was in German, it felt really good to be a part of something and contribute.

With a decently huge team, after a bunch of brainstorming we came up with the idea that supported the following functionalities:

  • Diagnose and recommend the next steps of actions for a patient after he takes a questionnaire. (of course, leveraging an expert system here)
  • Support a dashboard of statistics that deep dives on the available data from official platforms (via APIs) and provide visualizations on the analyzed data. Eg: Temporal evolution of cases per state, Cases divided by age groups and Gender, Geographical heatmap on the severity of infection spread, etc.
  •  Pass the results from the questionnaires to a model to predict how "COVID-19" the patient is. (scale of 0-1)
  • Use the predictions from the model, to chart out the potential cases that could be seen in the coming days in a given geographic area.
  • Allow the registered hospitals across the country to register encountered cases on a daily basis that can, in turn, be used to derive statistics.
  • Expose the derived stats to the interested 3rd parties.
  • All the above insights might provide the government to come up with a decent plan to tackle the situation.
I was initially asked to come up with a very raw wireframe for the app. I suck at UI, still, I  thought at least I'll try to have a decent flow for the app as per:


I tried to have 2 roles, patient and the admin, as the patient does not need to know the statistics (for all we know, he might panic even more!) . The admin will have access to see the stats, register cases for a hospital etc.

There were amazing UI, Backend and Data Science experts in the team who were involved in building of the prototype. I tried to squeeze myself in one of the data science tasks. As it was just a prototype, and due to time limitations, we decided to use a snapshot of the actual data and build the above functionalities (hence, db or no db doesn't make much of a difference here).  

I contributed in the tasks of data gathering, data munging, basic EDA on the data and finally visualising the insights. Used Python for these tasks and plotly for plotting. Felt good :) 
Also, while we were exploring the feasibility of having MongoDB, I also setup a basic Node JS server and doing a basic CRUD on MongoDB,  although, it wasn't possible to have it, as I had to focus on the data science parts.

Finally, it was amazing to see the coordination within the team and integrating all the moving parts. Not only did I get to explore technical stuff (WebApp stuff, Data stuff) but also several aspects in managing a team/ provide constructive suggestions, / organisational tools, discuss possible approaches to achieve a subtask etc. Would've enjoyed even more had I known German :-\

And we had the submission:


and the app is running here:


Everyone killed it hard! Kudos to the team.

Improvements from my perspective:
  • Currently the model predicts the degree of sickness using the patient's response from the questionnaire as inp features. It might be too biased to rely on the features entirely, as I think there is always the degree of uncertainty that should come to the picture. So I think, considering the distributions of the parameters of the model via Bayesian Learning (Bayesian Linear Regression or Bayesian Neural Network or as a Gaussian Process - via Kernelization) might make sense here as this approach allows us to have a sense of doubt while making predictions (the distributions gets updated via posterior beliefs).
  • Also, I think an Online Learning system might make sense here, as the model needs to improve on a real time basis as and when it encounters new data.
  • And if there is an issue of data privacy, there is this Federated Learning that allows the model to get trained and deployed across local devices without having a global access to their data. The final server will just exchange model parameters from the hospitals but not their actual data.
So combining these might make the system really powerful, am not sure about the intricacies, just a thought.


Monday, October 28, 2019

General stuff

At my student job,
  • I started with porting a neural net script that was a part of a Research Paper, implemented in Caffe library to TensorFlow. Things were pretty straight forward, I had to get TensorFlow equivalent of the Caffe's weights.
  • Construct the architecture defined in the paper in tf, load the weights. Here is when I explored sessions in TensorFlow, that lets me save weight loaded variables, that I can re-use for determining final predictions.
  • This was followed by a bit of Image Processing where I had to segment the image semantically, followed basic approaches for the same. Have used the nearest neighbour to evaluate the semantic meaning of the pixels.
  • Post this I had to explore techniques for anomaly detection - some of them were OneClassSVM, Feed inp to ResNet - use its features(last but 1 layer's op) as inp to the OneClassSVM, as I mentioned in the previous posts. 
  • As of now working on trying to reduce the representation of a given image/patch (dimensionality reduction - basically projection the given data into a lower space) and then reconstructing the image/patch in that lower space. Post this, compute the reconstruction error to try and pinpoint the image/patch that was relatively difficult for reconstruction.
Anyways, now I want to explore semi-structured analysis (textual stuff), after a bit of exposure to a few NLP techniques at Uni, I am exploring the same a bit more.

I am not sure if I'll work on this, but I have an idea that I'd want to implement.
Recently, I got a chance to explore OCR a bit using this lib tesseract (https://github.com/tesseract-ocr/tesseract) - that is used for extracting text from Images.., and sometime later in a video on youtube, I came across this GloVe - Global Vectors for word representation, (https://nlp.stanford.edu/projects/glove/) which is a research by Stanford.

- So a text can be stored in several ways for performing analysis. 
- One way is to record each word's frequency and use Bag Of Words - vector representing the count of each word and its position.
- Or I can just use an incidence/boolean matrix, to just indicate if the word is present or not.
- But GloVe, it represents each word in a pretty epic way, by retaining the contextual meaning of each word. Each word is represented as a vector of several dimensions, such that, similar words have similar vectors (cosine sim might be high). 

So of course, there is a lot more that I need to explore about GloVe and its usage.
But I thought if I can combine OCR, use GloVe for the extracted text embeddings, and be able to summarize/ predict/ analyse the given text (preferably using RNN or something similar as it keeps track of the timesteps)(Not sure about this part, but I think as of now, I would consider it progress if I can do the OCR part + word embeddings using GloVe part)


Takeaways:
  • Some insights about my part-time work.
  • Initiate new exploration :) 

Sunday, October 27, 2019

Uni Learnings

So, I thought I'll dedicate a post for the stuff that I get to explore here at the University. Also, include the topic/tasks that I am exploring at work - to have an idea about how the topics get translated to real-world use cases.

SVD - Singular Value Decomposition -

  • From what I have understood, this lets me decompose the rectangular matrix into 3 parts - left and right orthogonal matrices and a diagonal matrix. 
  • A use case for this was, in the Information Retrieval area, where I had like a sparse matrix - terms Vs document ..so like each document was represented by a  vector of 1s and 0s, where a 1 implied the term is present in the document, 0 otherwise.
  • I can give this matrix to the SVD function, that spits out 3 very VERY useful matrices- 
    • terms Vs topics
    • topics Vs topics
    • topics Vs documents
  • So the topics are like categories to which the text belongs to, (Sports, Food etc),
    • By mapping each of those terms to a set of categories and in turn using those categories to decide like the genre of the document is pretty cool.
  • This can help me in retrieving documents better for a given query - by considering the context. There are ready-made functions for performing SVD, just have to str the data properly to feed it in.
  • This is pretty cool especially if one is building some in-house information retrieval system for an organisation.
Map Reduce paradigm - 
  • Framework for distributed data processing. 
  • Damn cool technique iff, I can frame my problem as an MR task.
  • In simple terms, there is a Mapper - (Sort and Shuffle) - and Reducer nodes that do-
    • Mapper - Emits out Data tuples grouped by a key.
    • Reducer - Gets the Key grouped list of data tuples and performs some kind of aggregation. (count, sum, max, avg...)
    • One use case that I can think of is, lets say if I have several 1000s of docs spread across nodes in a network and I want to bring all the docs of each class in separate nodes, count # of docs in each class, perform some kind of textual analysis (relevance/priority), the Map task can like emit (category_id, <docId, content> ) and reducer will receive a list of (category_id, [<docId, content>,<docId, content>,<>....]) that can then aggregate all the tuples in the above list that belongs to a given category.
    • Internally the framework supports the part where all similar docs are directed to 1 reducer only and also sorted. Uses hashing principle, something like, a doc that belongs to a category id '54' may be mapped to a reducer number given by 54 % #reducers (Ensuring all docs of category 54 will reside in the same reducer.
    • There are several such intricate details in the MR framework and of course, Hadoop was the main framework that supported this I just need to write codes for the Mapper and Reducer task and rest everything is taken care. This can be used if 1 is searching for distributed processing (Of Course there are others like Apache Spark)
Signal Processing from IMU:
  • If one is interested in making sense of the motion that is captured by devices like an IMU (that is built-in on phones), one can make use of this app called Science Journal by Google.
  • That is a brilliant app that lets you capture acceleration (any axis), Ambient light in the room, sound, music and many more. It leverages on the IMU unit on the phone and lets u record stuff at will.
  • The best part, you can download the captured information as a CSV!, and now it's just any other data.
  • One can play with this data in several ways - 
    • Apply a version of clustering technique (K -Means, Hierarchical, DBSCAN...) to the data to "discover" similar segments in the signal.
    • With the knowledge of the type of motion, use this data to capture similar motions in the future, like a familiar gesture or something.
    • Detect the amount of light in the room and act accordingly.
    • Detect the level of the sound signal in the room and act accordingly.
    • One can choose to integrate all this to like an app that he/she is developing.
    • ML is just 1 step in the bigger project that can be developed.
    • Or 1 can go all out, and combine all types of signals and determine activity.
  • I can use the evaluation technique like constructing a confusion matrix (that captures False Positives, False Negatives and in turn Precision and Recall)

PCA:
  • Very similar to SVD, this technique is done for Square matrices that capture data records Vs Features.
  • If there are like 1000s of features in the given data and I do not know what to consider to perform analysis, predictions - I can rely on this technique Principal Component Analysis.
  • That allows me to strip off some columns that are not that representative of my data in-comparison to other stronger ones.
  • I need to construct a matrix called the correlation matrix that captures how 2 columns/features are correlated (as in, if an increase in 1 leads to an increase in another)
  • Now, I need to perform Eigen Decomposition on this Correlation matrix, that spits out 2 parts-
    • Eigenvalues and Eigenvectors (these are called the principal components)
  • This works based on the rule, AV = Î›V; A- co-occurrence matrix, Î› - Diagonal Matrix of eigenvalues; V: Matrix of Eigenvectors
  • So the vectors are arranged such that, the starting vectors (that are associated with largest eigenvalues) has the largest variance, i.e explains the data to a large extent in-relative to the ones that come later.
  • So we can restrict by stripping of vectors/components that are at the later stages, that is not representative of the data and retaining top-k vectors combined with their eigenvalues as our new data that has been reduced to a lower dimension.
  • This technique has been used in several areas including Genetics (to find the relevant gene), Eigenfaces - to generalise a whole collection of Human faces to capture unseen faces.
  • Can be used in several areas (including Images for learning their features- pixels.. )
MinHashing:
  • A technique that can be used for comparing documents that are too large to compare their raw boolean vectors. (where each dimension corresponds to a term)
  • To do a raw comparison, metrics like Jaccard Similarity, Jaccard distance, Euclidean, Manhattan, L1, L2 norm and many more can be used.
  • Jaccard distance although is very handy is computationally expensive(See formula) to be performed for several large sets.
  • MinHashing is a technique that hashes such large column vectors of documents to signatures with much fewer rows. The technique is pretty cool,
  • https://www.youtube.com/watch?v=96WOGPUgMfw&t=1080s
  • The gist is, it considers a permutation of rows(which are terms in docs) and captures the index(row # in that considered permutation) of 1st word that occurs in the document.
  • In the final hash, Number of rows = number of considered permutations, and it has been proven that determining the probability that the hashes of 2 columns (or docs) is same as Jaccard similarity of the 2 docs.
  • Overall, one can use this technique if he needs to find similarity of severely large boolean vectors by finding the MinHash signatures of the vectors and determining the fraction of them being equal.
TF * IDF:
  • Really cool scoring model for documents.
  • One can use this while building an in-house retrieval system, by ranking each doc based on their Tf*IDF score for each term of the input query.
  • Eg: If am searching for "Places I can visit in India", all the documents in the database can be ranked based on a score that is calculated for each term of the query and returns the docs in the descending order.
  • TF - Term Frequency, IDF - Inverse document Frequency - Intuition is like, if the count of a term is too high in a document (term freq), that does not mean its important for that document, it also matters in how many documents the term appears (document freq).
  • There are other complicated scoring models like the Okapi BM25...
Evaluation techniques:
  • I can evaluate my prediction system, information retrieval system etc... using several metrics.
  • I need to have the overall collection of docs at my disposal, which is relevant, irrelevant for a given query..
  • I can use Precision that captures the fraction of the retrieved documents that is relevant.
  • Recall - that captures the fraction of relevant documents that are retrieved, this is harder, as I need to know all possibly relevant documents for a given query, not just the ones that are retrieved by the system.
  • F-Measure, the measure that is unbiased between precision and recall.
  • I can use a matrix called the confusion matrix, that captures how accurate my model is.
  • One needs to strike a balance between Precision and Recall, as too high Precision might come at the cost of a lower recall and vice versa.
  • Precision, Recall and hence the confusion matrix needs to know the True Positives, True Negatives, FPs and FNs for determining the metrics.

The similarity between vectors:
  • One can use Cosine similarity between vectors - that forms the basis for User-based and Item-based recommendation systems.
and many more..

Takeaways:
  • Some of the good to know widely used techniques to get better clarity as to how one can go about processing the data at his/her disposal.


Wednesday, October 23, 2019

It has been quite difficult to keep up with posts. But it shouldn't matter as I am doing this as a release valve to sort of journal my thoughts.

So here is what I got to explore with respect to the CNN part using Neural Nets.
Having a basic, decent background in Convolutions/ Image processing from Uni, I referred https://www.datacamp.com/community/tutorials/cnn-tensorflow-python.

Tensorflow:
So from recent podcasts and videos I realised Tensorflow has this static way of creating Neural Nets, where I create a computational graph - basically I define a set of nodes in a graph that depicts the operations (convolutions/add/matrix multiply,etc..) for the incoming data, the edges representing the flow of data. (Although I came across Tensorflow 2.0 where there is an eager execution that gives one a lot more control to intercept data flow in the NN). Once I define the network entirely, I make use of the TensorFlow sessions to feed data into the defined the network. It Seems, this approach helps a lot to distribute the training process.

But it was a lot to code stuff from scratch, hence had to refer that blog, where I had ready-made code. I just had to understand stuff, which was decently hard, given the previous knowledge on Image processing and CNNs. But it was hard and confusing to run it directly.

Data Cleaning:

Had to realise this the hard way.
--
I got a chance to explore this technique called One-Class SVM for like a binary classification at my student job. Again, this was for Image anomaly detection. Overall, the task was pretty interesting, explored various approaches that I could have potentially taken. Some of them were:
- Give Image train data to the OneClassSVM API of sklearn, although it was a bit restrictive and not available in all versions.
- Apply PCA to the image data to retain the features/pixel data that explained maximum variance (shall try and cover such handy concepts that revolve around data processing/ pre-processing in the next post)
- Use ResNet to get The Most relevant features from the image and then apply PCA - post which gives the features to One-Class SVM. this was pretty interesting as per the link https://hackernoon.com/one-class-classification-for-images-with-deep-features-be890c43455d
- Lastly, it was the Autoencoder approach, which I have never explored, but I'd want to someday on an application that interests me. (semi-structured data)

But the sad part was, I NEVER really cared about how my data looked. I was in such a hurry to get the insights, I never gave a damn about the data. Unfortunately, it was largely crappy. It was skewed, un-curated, not representative enough, so I was asked to drop the whole task itself :( (time constraints)
--

Anyways, continuing with my exploration,
when I was about to drop the idea of using Tensorflow for this (which was pretty confusing for me - but was worth the experience), a friend asked me to explore Keras. It is too damn readable. 
A highly simplified way to define the network. This is when I realised, I NEED to stick to the larger picture in mind, no point taking a difficult path when either way I reach the same destination.


Built a basic NN using Keras with:
-32, 3 x 3 filters in the first layer (that took 1 channel from the inp image - grayscale)
-64, 3 x 3 filters in the second layer (depth 32 from prev layer)
-128, 3 x 3 filter in the 3rd layer (depth 64 from the previous layer - here, I realised, as u go further in the feed-forward network, the depth of the cube- Conv layer, increases rapidly, leading to HUUUGe number of neurons, in turn weights that is to be computed!)
-Flattened the layer (with prev depth 128!)
-A Fully Connected Dense layer with 256 neurons
- Finally a fully connected layer with the number of neurons that represents the number of classes that I want (in my case, the number of fruits)
- Forgot to mention about adding a MaxPool layer between each Conv layer, that halved the dimension, but retaining only the "strongest feature in the previous Conv layer".
- So, here each filter corresponded to an activation plane, that slides across the image, to "filter" out the "relevant" parts from the image. In other words, relevant neurons in the activation plane of each plane trigger the neurons in the next layer.

A few key observations:.
- Used Relu as activation for each neuron, that strips off negative values and retains max values. (there is also Leaky Relu)
- Use softmax (that gives the probability of each class) as the activation function of the last layer, that can be used to determine how relevant each category is for the Inp Image.
- Use batch gradient descent, that speeds up the convergence.(reaching the bottom of the loss bowl)
- Use Dropouts, that randomly switches off some nodes to increase the relevance of the final result.
- Use Momentum (that considers previous cumulative gradients- velocity+friction of the ball in the bowl, and current gradient - acceleration of the ball in bowl =- Andrew NG example) /Adam optimizer/ RMSProp optimizer.. and many more that can optimize the cost function.
- Like my Prof taught in class, Any model can be ultimately written as : 
hypothesis = regularizer + (regularisation constant) * (loss)
we just need to optimize the objective function such that the loss is minimised through (to find the weights and biases)
 Backpropagation - partial derivatives, Lagrange's Multipliers - KKT that can find the best values for weights across layers that minimizes the cost function.
- Use softmax - cross-entropy loss if using categorical values for the loss function,
- Can use Root mean squared error, mean squared error, L1 norm, L2 norm, Manhattan etc as loss function...or others if using regression ie predicting values but not categories. A lot to explore here.

But unfortunately, my PC is running out of juice, not able to keep the notebooks active. But as of now, I am getting a decent accuracy of around 73%. I'll probably either integrate this with the OpenCV that I had explored in the beginning OR explore something else.


Takeaways:
  • Explore a lot more approaches/topics before sticking to one. As immediately boiling down to a selection can restrict the exploration stage.
  • Its good to stray away from the main goal - Iff you can afford to do so - on the way u may stumble upon many more exciting things.
  • Realised Videos/Podcasts/Tech talks, gives u whole new perspective towards things.
    • Came across some really cool channels on youtube Lex Fridman, Strange Loop - this gives a good perspective towards translating ML stuff to industries. (Netflix one was really cool)
  • The wave of examinations over the past months provoked me to at least document the topics that I came across while studying. Some of the techniques, tools are really handy and seems like it can be appreciated more if I have documented some of them here.
  • As a next step, I'll try running the model against new images of fruits, see if it works, post that, try and see if it works for a live image captured from web camera.
  • Also want to sort of exploring semi-structured analysis for textual stuff, NLP, TF * IDF, lang models etc.


Tuesday, July 23, 2019


It has been a pretty hectic semester. Hence not able to keep up with the writing. There are  lectures, assignments, student job.. lots to keep me active round the clock.

But the good news is that my lecture contents, and to some extent my student job as well, are sort of in sync with what I wanted to do here.They helped a lot to get a clearer understanding on certain topics. And also there is an exam on the topic in 2 days :D

So far, I've got a decent picture about Convolutions and incorporation of convolutions in the Neural Network with intermediate blocks Relu (to bring in Non-linearity), Max-Pooling, strides.. There is this awesome formula that gives me the dimensions of the filter outputs : output width:
 (initial width  + 2 * padding - Filter width) / (stride ) + 1

To sort of brief it up, here is what I could come up with, acc to my understanding:


So the story goes:
> I have the image of a fruit bowl and say I have a torch (with like a rectangular bulb to represent the square filter (5 x 5 x 3) as shown in the above image)
> I just slide the torch across the image - Each time when I am in a new position, I convolve(dot product) the torch with the corresponding area in the fruit bowl image where the torch is shining its light.
> The convolution operation is just multiplying the weights on the torch head with the corresponding image pixels in the area where the torch is shining its light.
> In the example picture above, the torch head is the 5 x 5 x 3 filter, and the area where the light shines in the image is the small red box , now I convolve these 2 to get 1 value which I store as a red blob in that second plane as drawn in the figure.
> Now I move/ slide the torch head - now the light is shining on the purple box. I convolve these 2 to get 1 value - represented as the purple blob in the second plane.
> Now I continue this and fill up that plane - this is called the activation plane.
> Activation plane represents the result of sliding the torch head (filter) across the image.
> Intuitively the filter tries to "filter" stuff out. As in, it could be a filter for detecting say edges or curves.
> Eg filter will have like

 to sort of detect the symbol 'U' and discard everything.
> So the 4 x 4 image regions having 'U' in them will have higher result in the activation map's neuron in relation with other 4 x 4 regions.
> Like so there could be several filters in 1 Convolution layer itself, which in turn results in that many activation maps.
> One can visualize this output of multiple filter as a box (number of neurons drawn are not exact):


So here, there are 4 planes in the box => 4 activation maps => outputs of 4 filters that were convolved with the input image.


> Why is this done?
> So that I can detect for eg blobs or polygons..shapes.. solid shapes etc in the next layer.
> Here the intuition can be a real human eye which detects stuff layer by layer:
     to identify an object, our brain first sees the edges(layer 1) then shape(layer 2) then the texture (layer3), finally recognize the object.
> The above box is essentially one more image/input with dimensions 6 x 6 x 4 .. just like the input image..
> Hence I can have additional filters in the next layers, by taking this box as my input and try run my torch against this new box.
> This leads me to being able to detect higher level features like say solid shapes...
ultimately the CNN structure might look something like :

((Layer - Relu) * m -  Max-Pool) * n - (Fully Connected Layer - ReLu) * o - SoftMax. (flicked from my lecture notes :D )

> Here, Fully connected layer is like the normal NN, where all the 35 * 35 * 3 pixels of my input fruit bowl are connected to specified number of neurons. This is super complex operation, hence not used since the beginning of the layers... Hence the torch sliding helps reduce the number of computations.

So the ReLu, Max-Pool, SoftMax are pretty intuitive concepts which I shall be covering in the next post.

TakeAway:
> Bigger picture of what CNN is all about how one can detect stuff with a CNN architecture.
> Bit deeper into the workings.
> Intuition on Convolving a filter across an image.
> Concept of filters.
> Interpretation of Filter outputs as neuron-contained activation maps.
> On a side note, I might consider using tensorflow for directly building a basic CNN and train the model. Not sure when, probably after exams.

Monday, April 15, 2019

Begin.

It's been a while, caught up with exams, onset of overwhelming yet exciting subjects of the new semester.

So a couple things happened actually,

> Started exploring the implementation of basic neural network on the web. (without the optimization or even the validation part!). Main intention was to see the entire flow in action hopefully in a graph!).
> After some googling (there were ready codes available):

Here is what I tried to implement -

> I decided on a basic neural net structure, straying a bit away from what I wanted to be able to predict in the first place.

> This is what I wanted to implement


A few things that I explored on the way-

> I used a dataset that was given as a part of a course by my Uni, (Titanic survival dataset- which I think is available on Kaggle).
> I wanted to play with the dataset, hence explored a bit of Pandas - yet again, it is one powerful and beautiful utility! Using jupyter notebook as its just awesome.
> Realised Pandas understands data in terms of dataframes, awesome way for filtering, doing a basic EDA on the given data to get like an overview of the data.

> 1 important step which I had to unfortunately realise the hard way, was the part where I had to thoroughly 'clean' my data.
> Here, I explored why I was supposed to clean the data / How can i do all this in Python
              1. Remove NaN - non numeric values.
              2. Convert categorical data to numbers (Enumerations)
              3. The important one was Normalisation  - Sort of having all of the features in a standard scale. Like there could be a column A whose range is 1-5 and 1 more B whose range is 1000-60000. > So in this case, if they are used the same way, as pointed by this person on youtube, the weights assigned to those features might heavily rely on the numeric values alone and not its influence on the result - as in, if A has the value 5, B has 1000, B might be given the wrong weightage.
              4. Hence normalize using, X = (val - mean) / standard deviation - Stand deviation describes the spreadness of my column.
              5. To sort of squish the values of a column btw 0 and 1, I can use X = (val - min)/ (max  - min)
              6. Initialise the bias column (np.ones) to X.

> So I wanted to predict the age of the passenger given his/her features - something like, given his/her economic status(class), location....accompanied by .. price of ticket purchased... , try and guess their age.
After cleaning the data bit,  I decided on the label (age)..

> O, I also need to squish the Y or labels between 0 and 1! as my NN gives me values between 0 and 1! Totally forgot to do this till the very end, hence I used to get faulty error function! Error function had errors :D


> Formed the backbone of the NN that had like 2 internal layers excluding the input and output layers.
> The weights to a layer followed the format:
ex on layer 1
[
     [weight on neuron 1, weight on neuron2, weight on neuron 3 ],  // for feature1
     [weight on neuron 1, weight on neuron2, weight on neuron 3],  // for feature2
     [weight on neuron 1, weight on neuron2, weight on neuron 3]   //for feature3
     [0.1, 0.1, 0.1] //bias weights
]

> I had to initialise the weight matrices (numpy.random.rand) - initialise bias weights (0.1) as well.

> Multiplication between several matrices was a pain! was too hard to ensure the shapes of the matrices are to be maintained - obviously I could not figure stuff out myself, went wrong at several places real badly, hence I referred the web.

So the structure was something like:


> Also yes, for backward prop (climbing down the error hill), the gradients for all 3 weight matrices for 3 layers, unfortunately  I referred the web for the ready made formula - but yes I understood the partial derivative part and how they derived the gradient wrt diff weight matrices using chain rule.

So this is the cost function (difference between actual and predicted values) that I plotted using Matplotlib


So yea, the flow seems okay, as in -
> Yes the cost function seems to be decreasing. So the offset btw the actual and predicted values seems to be decreasing at every run.
> But 1 main thing that I am not doing here is the validation and optimization part..
> This expects me to address train - cross validate (model evaluation) - test (error) part.
> And also if there is overfitting or underfitting in the model. Apparently there are techniques to prevent model from overfitting (the selected weights for features is highly inclined towards the training set and does not generalise well for new incoming data)
or
underfitting (the selected weights for features is highly generic and does not predict stuff well)

> Some of them are -
                   Have more data,
                   Regularization,
                   Drop Outs to prevent Overfitting.
                   Change network architecture
> Techniques to rectify underfitting  -
                   Have more layers
                   More neurons in each layer
                   Change net architecture

TakeAways:

> Need to decide on the neural net architecture first -  layers, neurons, learning rate, num_iterations and stuff.
> Data cleaning - data munging - data wrangling - to clean non-numeric values, enumerate categories, normalize the data(features and labels).
> Initialise weight matrices - add initial bias weights column (column of some 0.1 initially) as well!
> Add bias column (column of 1s) to the input features. (bias - used to fit the model better)
> Pandas for data exploration - dataframes, effective filtering, selection and manipulation of the data.
> Understand how the feature matrices are represented which when combined with the weight matrices results in activations that is passed onto the next layer.
> Ensure the shapes of matrices are maintained across layers.
> Understand how gradients for different weights are calculated using back prop and hence the partial derivatives (chain rule was confusing!)
> The chain rule formulas are faulty - as in
             - the biases that were added in the beginning to the features and weight matrices had to be handled for each weights.
             - had to transpose a couple results to ensure right shape is maintained. Was confusing! Hence copied off the formulas from the web.
> Satisfactory decrease in the cost function across iterations! Plot was nice to visualize:) but unfortunately have handled nothing.


> Need to incorporate train_cross-validate_test split for validation of the model.
> Also need to incorporate regularization, drop out to prevent overfitting(inclined to train data)
> Explore possibilities of underfitting as well.
> There is also something called gradient checking to double check if the gradient descent achieved in the model was right.


> Offf, that was a lot I had to explore in parallel with other things, I think some of them were incomplete...but its fine..I think I have a fair idea about the story..,
> for the next steps, with this background , I think I'll dive into CNN, and learn on the go types  (Optimizations can be done directly wrt CNN)
> Have also enrolled for Coursera's Andrew NG's Deep Learning course. (One can audit this as well for free!)
> Have also audited the course on linear algebra on Coursera - the math for ML.. to sort of be able to appreciate the math better! Not sure if I can keep up.

Also, not sure if posting the code makes sense. I feel the satisfaction to see one's own code in action is awesome! So, even if a bit of effort is made to go out there, make an attempt to understand already written code snippets (which they say is far more challenging than writing ur own code), is worth it! :)

End.